May 12, 2026
Closing the Gap Between Marketing Activity and Commercial Return
Listen to this insight
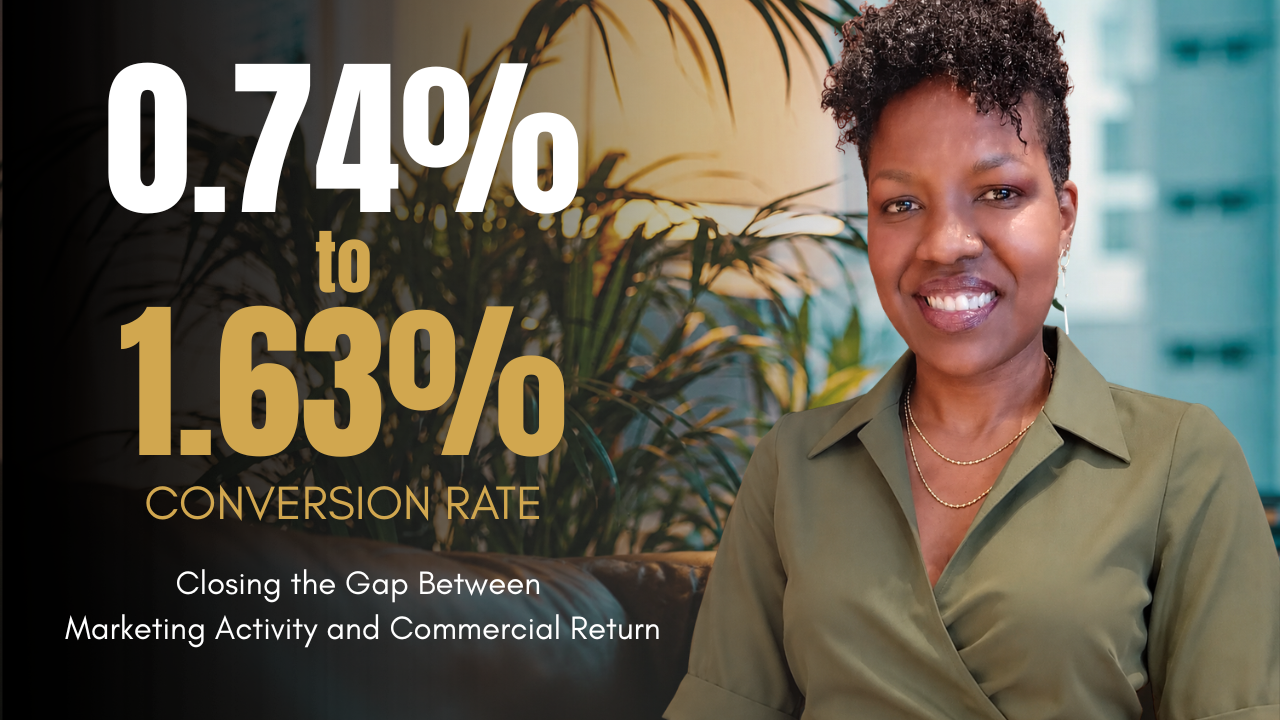
Paused0.74% to 1.63%: what a twelve-week restructure revealed about how marketing should be measured.
The Investor Perspective
The investor's position was understandable. Customer growth was not following the marketing activity. Paid media ran for a period gaining a higher follower count, but no incremental customer growth. The activity was considered a waste of investment and all spend was cut. From the investor's position, this cut was reasonable: money went in, brand presence increased, customers did not follow in any measurable proportion. The team's defence hinged on reach and impression volume, but this failed to answer the question the investor was actually asking, which was whether marketing was generating commercial return.
The Audit
The problem was clear when I looked under the hood. The operating structure didn't demonstrate their value in actionable business terms.
Marketing activity almost solely relied on social media with email being an ad hoc activity. The main metrics being tracked and reported were activity metrics: impressions, reach, follower growth. These metrics don't indicate whether marketing activity was generating customers, at what cost, and through which channels. There were no systems built to signal the effectiveness of the marketing, and without those signals any investor would be skeptical and the founder would have no credible counter.
There was also no funnel architecture connecting the channels to each other. Awareness was accumulating at the top, but there was no deliberate structure carrying that awareness toward conversion. Each channel was operating in relative isolation, which meant reach was not being translated into anything the business could measure or build upon.
Paid media had three specific structural problems that, once resolved, could signal that the decision to cut paid spend was a misdiagnosis. The creative was oriented around brand presence rather than customer value: the ads communicated that the brand existed rather than giving a potential customer a reason to act. Brand awareness messaging placed into a direct response channel produces neither outcome well. The targeting was also too narrow, which limited the data volume the platform's algorithm needed to learn and optimise, meaning the campaign was never given the conditions in which it could actually perform. And the spend had been run in bursts rather than continuously, which means each pause resets the algorithm's learning, compounding effect never builds, and every new burst starts from the same position as the last. The results looked like evidence that paid media was the wrong approach for this business. They were actually evidence of how paid media had been structured.
The 12-Week Build
Over the quarter the restructure of the marketing operations followed a defined sequence. After an audit, focus was on measurement first, then the channel architecture, then the reporting layer, with each stage setting the foundation for the next.
The measurement framework was rebuilt around cost per acquisition and conversion rate, because those are the metrics that connect marketing spend to commercial return. Other data remained visible, but it became context for understanding the primary signals rather than the basis for evaluation in its own right.
Paid media was moved to an always-on structure, run continuously at a sustainable level rather than in periodic bursts, because demand generation requires consistent presence to compound. Audiences need repeated exposure before they act, and the algorithm needs sustained volume before it learns what it is optimising toward. Consistent spend at a considered level produces better results than intermittent heavy spend, and it produces data that can be read and improved upon over time.
The funnel architecture gave the team's reporting its structure. Each week, activity at each stage was tracked not in isolation but in terms of how it was flowing toward conversion. This changed the questions the team was asking of their own data, and by extension what they were doing in response to it.
A dashboard was built alongside an interpretation sheet that mapped what specific metric movements meant in context and what action each scenario called for. When numbers moved in the wrong direction, the team had a diagnostic process rather than a reaction. This distinction matters operationally because a reporting framework that requires external interpretation every week functions as a dependency rather than a capability. The goal was to build something the team could run and read themselves.
The team's weekly reporting followed a consistent structure: what happened, why it happened, and what the course of action is. Run consistently, this disciplines a team to think commercially about their own output until that orientation becomes the default rather than the exception.
The board report was built around a different set of questions, because investors and operators need different things from the same underlying data. The framing was effectiveness, efficiency, and how the business would balance both along its growth curve. This gave the CEO the language to present marketing decisions as deliberate tradeoffs rather than individual results to be defended. In periods of high demand, a business should be willing to accept a higher cost per acquisition in order to capture the available opportunity. In slower periods, it pulls back and optimises. A rising cost per acquisition in a peak period is not necessarily a failure signal; it can reflect the correct commercial position for that moment. Without a framework that makes this argument explicitly, a board member reading a single metric in isolation will draw their own conclusion.
Across each stage the measure of success was the same: whether the team could operate it independently once the engagement ended.
What the Quarter Showed
By the end of the twelve weeks, the conversion rate was already 1.63%, up from 0.74% at the start. The team was running their own reporting process and upskilled to improve performance across the entire funnel. The CEO was having a materially different conversation with investors, because the argument being presented was now structured in the language that investors use to evaluate commercial performance.
The investor's original conclusion had been reasonable based on the information they were provided. It was also wrong, and it was correctable. This was now apparent, and they were more supportive of the business' growth strategy.
---
A question worth sitting with: if you were asked today to walk through how your marketing spend is generating commercial return, specifically by channel and at what cost per acquisition, how much of that answer already exists in your current reporting and how much would you have to go and find?